Skip to Main Content
Facebook
Instagram
Search this site
Submit Search
Home
Staff
About
Letters to the Editor
More
The Scratching Post
Open Navigation Menu
The Scratching Post
Home
News
Features
Sports
Opinion
About
Staff
Letters to the Editor
More
The Scratching Post
Open Search Bar
Search this site
Submit Search
Open Navigation Menu
The Scratching Post
Home
News
Features
Sports
Opinion
About
Staff
Letters to the Editor
More
The Scratching Post
Open Search Bar
Search this site
Submit Search
VHHS, D128 officials present future capital projects to public
Katy Brennan
, Editor-in-Chief
December 20, 2018
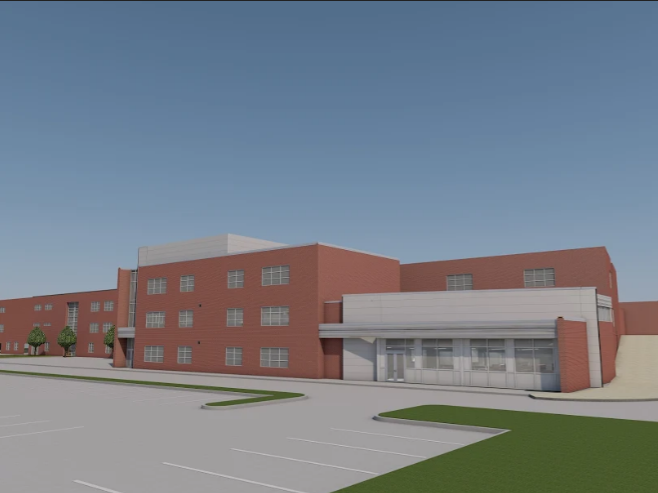
VHHS administration plans for addition
Katy Brennan
, Editor-in-Chief
October 12, 2018
Load More Stories
Close
Close Modal Window
Close